Written by Jonathan Fairman, PhD – Senior Scientist, Meteorology
Hurricane Barry forecast verification & post-event storm data
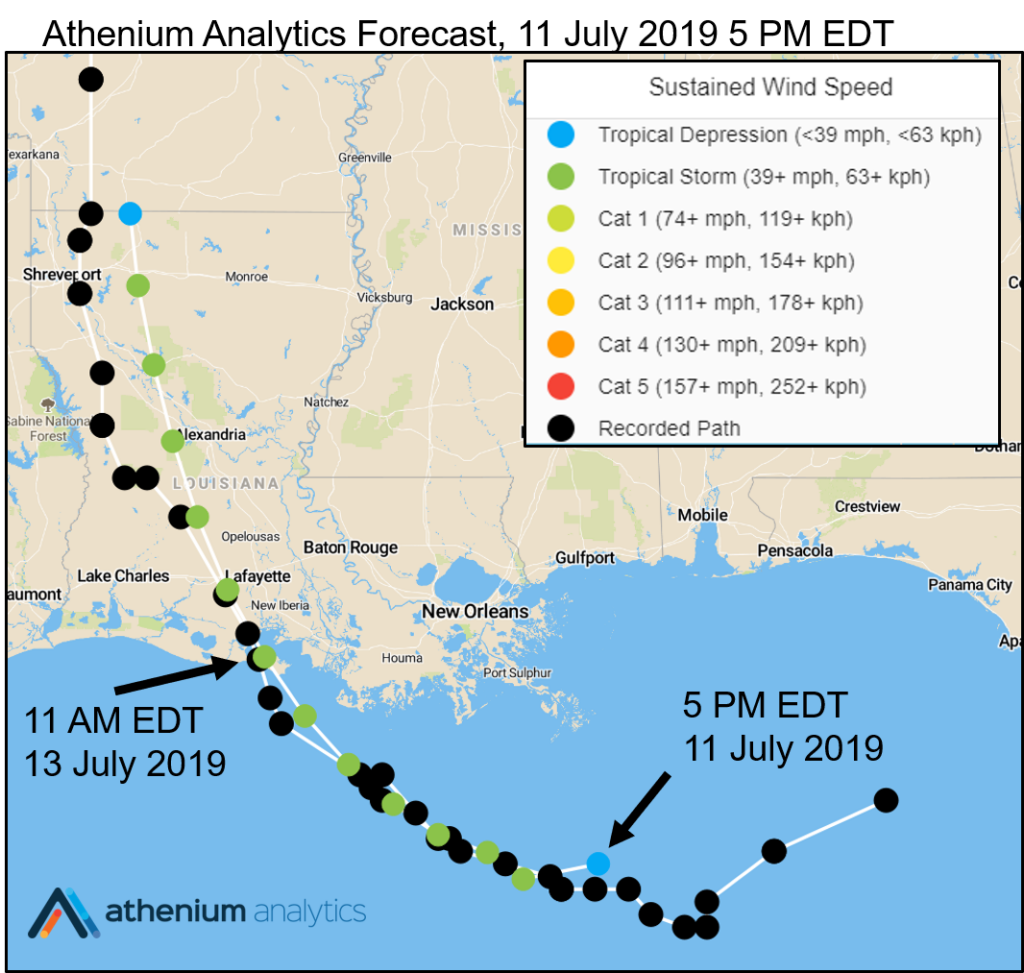
Figure 1. Hurricane Barry forecasts from July 11, 2019 at 5 PM were within 3 miles (5 km) of the expected landfall location 42 hours ahead of time.
Hurricane Barry made landfall over Marsh Island and Intracoastal City, Louisiana on July 13, 2019, as a category one storm – becoming the first hurricane to make landfall in the United States in the 2019 season.
Barry’s origin was atypical for an Atlantic tropical cyclone. Tropical systems in the Atlantic typically originate from tropical waves traveling off the west coast of Africa, or groupings of thunderstorms in the Caribbean or Gulf of Mexico. Barry, however, formed over Tennessee from a weak remnant low that started its life as a group of thunderstorms, called a mesoscale convective vortex. This vortex moved south over Georgia before turning to the west where it crossed the Florida Panhandle into the Gulf of Mexico, strengthening into a tropical cyclone over the warm ocean.
At 11 AM EDT on July 11, 2019, the system achieved winds greater than 39 mph (63 kph) and the National Hurricane Center upgraded it from a potential tropical cyclone to a tropical storm. Barry briefly reached hurricane status with maximum sustained winds of 75 mph (120 kph) approximately three hours before making landfall. After landfall, Barry weakened to become a strong tropical storm before moving inland and dissipating by the evening of Sunday, July 14.
Tracking Barry for our partners & clients
Athenium Analytics provides insurance carriers with up-to-date hurricane alert emails as part of BeaconHurricane, our proprietary 10-day hurricane tracking forecast & risk management tool. BeaconHurricane started issuing track forecasts for Barry on July 10 at 5 PM EDT, with the first forecast predicting the landfall location within 25 mi (40 km). Subsequent tracking forecasts were provided three times per day. By the 5 PM EDT forecast on July 11, two days prior to landfall, BeaconHurricane forecasted the landfall location within 3 miles of the eventual recorded landfalling location, along with an accurate landfalling timeline. The forecast provided 42 hours of lead time to the specific areas on the coast (see figure 1).
Now that Barry has become a remnant low, potentially bringing rainfall as far northeast as our office in Dover, New Hampshire, we have compiled the impacts that Barry had as a tropical cyclone on the United States. Post-event forensics data for Barry is now available to Athenium Analytics customers inside our DexterHurricane portal. Navigate to Dexter and select the Hurricane drop-down box in the upper left corner of the DexterTracker page. The data includes several different perils, including sustained wind (Figure 2), storm surge (Figure 3) and rain (Figure 4).
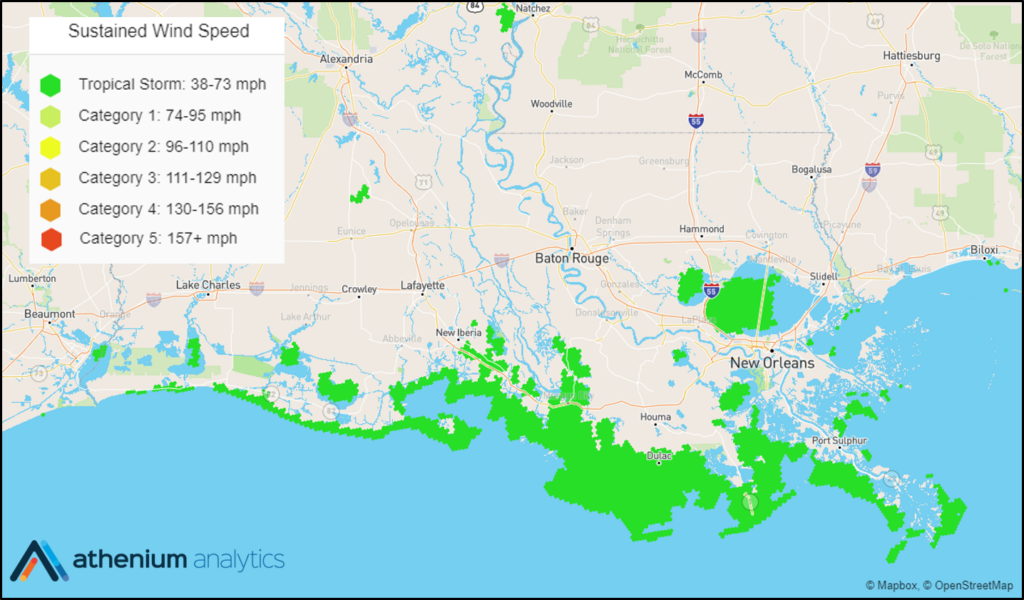
Figure 2. Sustained winds impacting the Louisiana coast from Hurricane Barry as viewed in DexterHurricane.
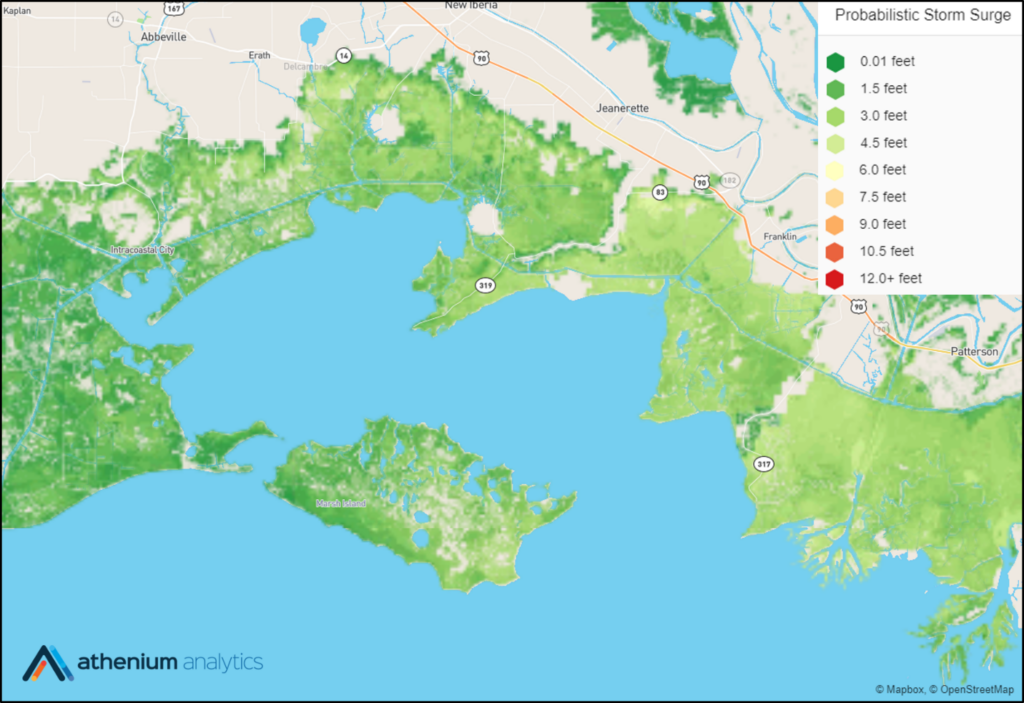
Figure 3. Storm surge from Hurricane Barry as viewed in DexterHurricane. The areas most affected experienced storm surge values of up to 4.5 feet (1.4 m) near the Wax Lake Delta.
Hurricane Barry landfall & storm surge
At the time of landfall, Barry was a category one storm, with sustained winds of 75 mph (120 kph), but the broad area of sustained winds (Figure 2) were at tropical storm intensity. The area of tropical storm level winds stretched across most of the Louisiana southern coast and extended to some inland lakes, including Lake Ponchatrain.
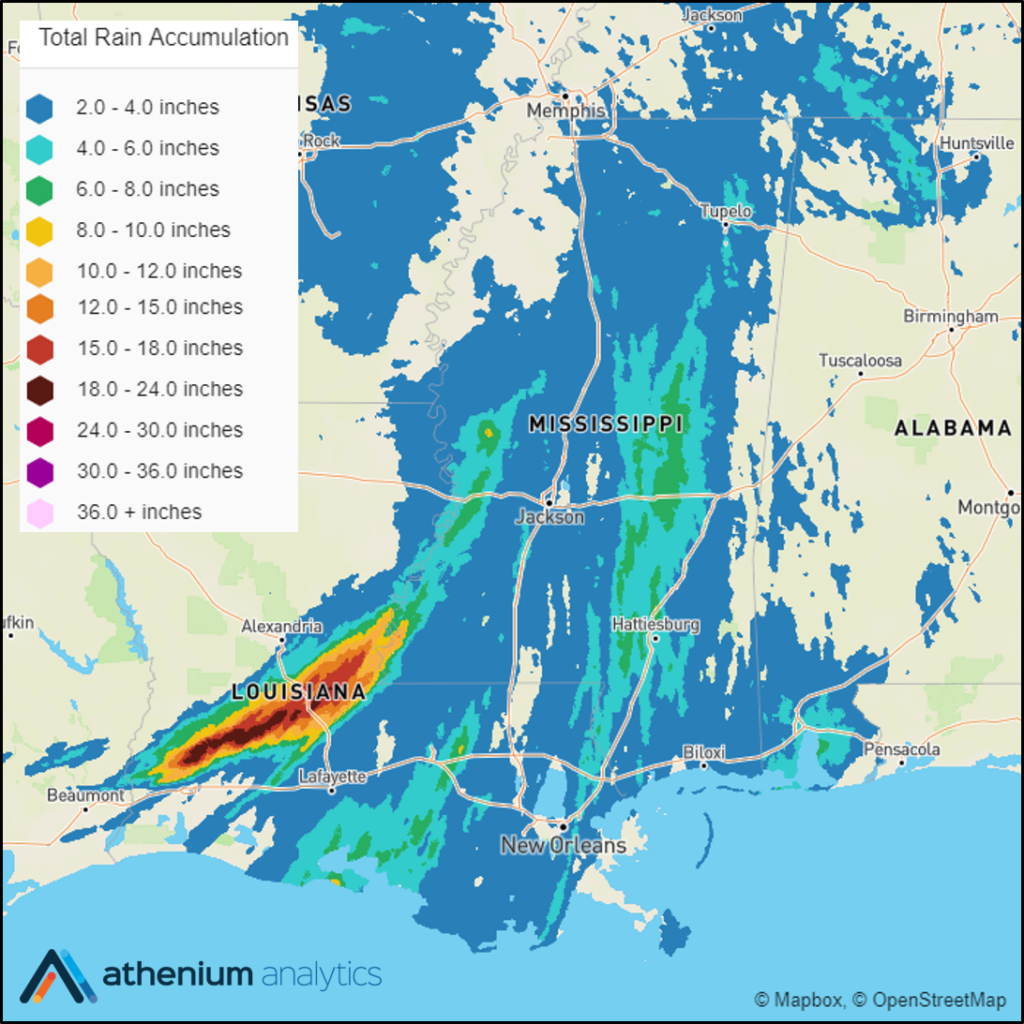
Figure 4. Rainfall swath from Hurricane Barry over the Mississippi Valley, as viewed through DexterHurricane.
Storm surge impacts for Barry were most prevalent in the Vermilion Bay/West Cote Balance Bay area and were particularly high over Marsh Island, Louisiana. Storm surge reports show impacts as high as 4.5 ft (1.4 m) in areas near Burns, Louisiana near the Wax Lake Delta. Areas near the mouth of the Atchafayala River south of Morgan City have also been affected.
Rainfall totals for Barry were not 10–20” (25–50 cm) across the entire Mississippi Valley, as originally predicted before landfall. However significant rainfall did occur. Accumulations greater than 18” (45 cm) were present in a narrow swath between Lake Charles, Louisiana, to the south and Alexandria, Louisiana, to the north. Near Vicksburg, Mississippi, rainfall accumulations over 6” (15 cm) were recorded.
Hurricane analytics for insurance carriers
Hear from us first. Better manage your book this hurricane season with hurricane forecasts and analytics from BeaconHurricane and DexterHurricane.
Speak with an account representative today to learn how some of the world’s largest carriers are turning to predictive analytics and forecasting tools from Athenium Analytics to better manage their natural hazard claims and underwriting during the 2019 hurricane season.
Click here to learn more about our full suite of Hurricane Analytics tools for insurance.

